By Tony Evans, Data and Analytics Consultant, Altis Consulting UK
Many organisations are investing time, energy and money into developing data analytics and visualisation solutions through Power BI but often have little insight into what content is being used and by whom. For example, they may not be able to answer questions such as are colleagues still wedded to their Excel spreadsheets and not using Power BI, or understanding which reports aren’t being used and why.
Building on our popular four-part blog series, Power BI, The Road to Success, this blog post takes a deeper dive into how we can measure usage, through Power BI’s built-in tools and by using the Altis Power BI Insight solution. Scroll to the end of the blog post to watch a short video demonstrating the Altis Power BI Insight solution.
“Out-of-the-Box”
The Power BI Service comes with a built-in usage reporting feature called the Usage Metrics Report. With a Power BI Pro license, providing we have edit access to a report and are at a minimum, set up as a contributor, we can view and create usage reports for our workspaces.
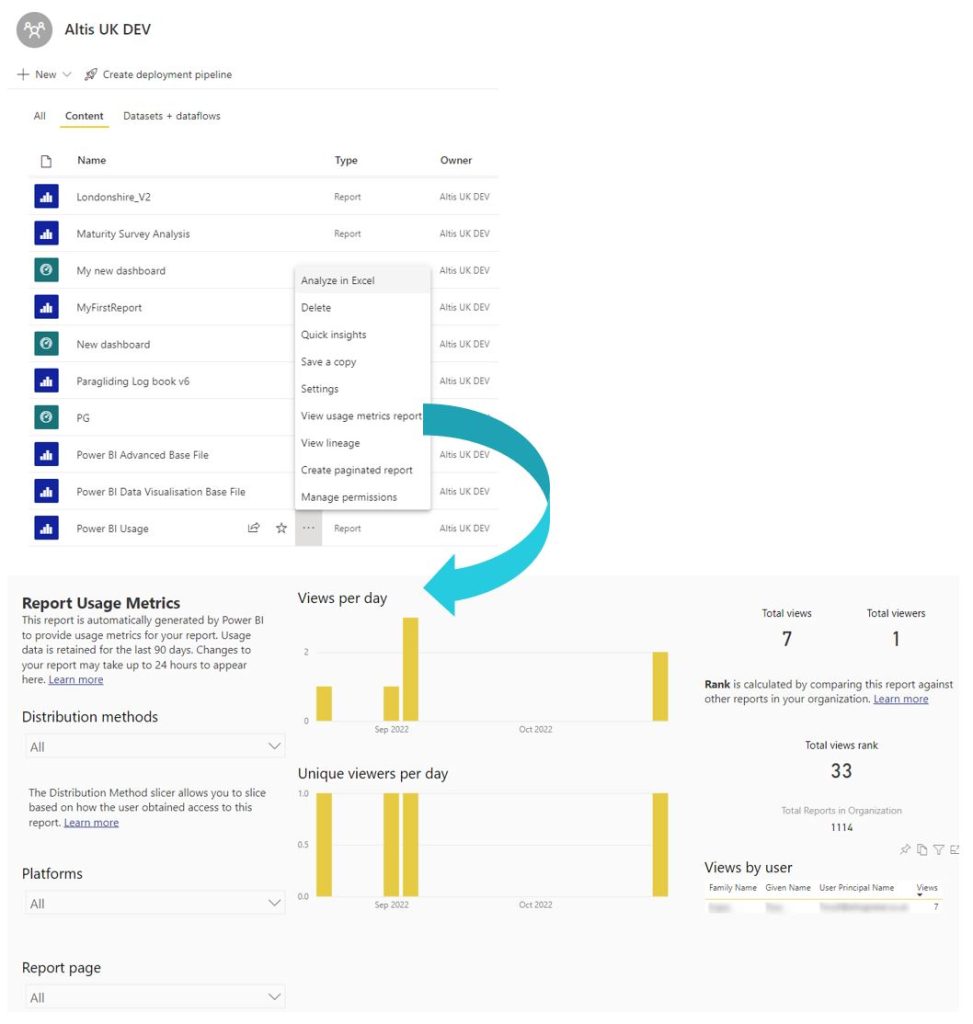
One of its advantages is it takes only a few minutes to set up, with no coding or report development. Once the report has consolidated (this can take time) we have a way of seeing not only who has viewed our reports and when, but which pages and on which platforms along with some basic metrics on usage trends.
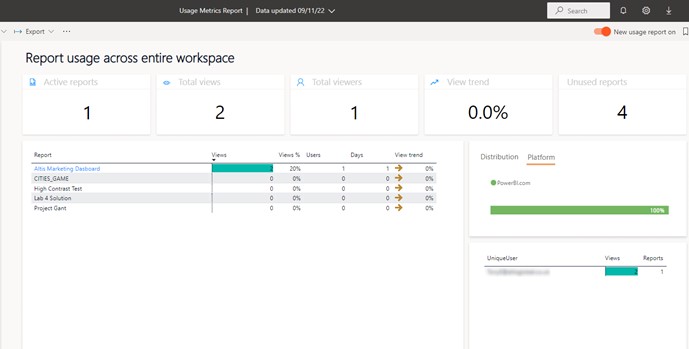
However, the Usage Metrics Report will only track data for the previous 90 days. User adoption is often not an overnight success, we may need, for example, to gain buy-in by running workshops to demonstrate our reports and dashboards and to gradually phase out legacy reporting and this can take longer than the 90 days of data tracked by the Usage Metrics Report.
Another problem is that we can’t add our own visuals or customise the look and feel by applying our own theme and, perhaps most importantly we can’t add our own groupings or metrics. For example, we may want to compare usage across departments – for this we’d need to add to our data set with a mapping between users and their departments and this isn’t possible with the out-of-the-box option.
There is a workaround to some of these shortcomings. When the Usage Report is created, like any report, it builds a new data set. We can use this as a data source in Power BI Desktop to create a customised report.
Now, we can apply our own data visualisations and custom themes, and, using a preview feature, bring in or create data tables alongside the usage data model with grouping, custom date tables, measures, etc. so potentially dealing with some of the shortcomings of the Power BI Usage Metrics Report.
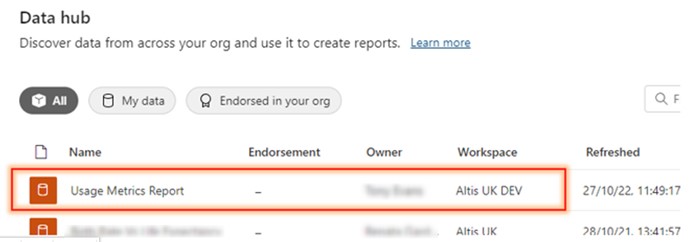
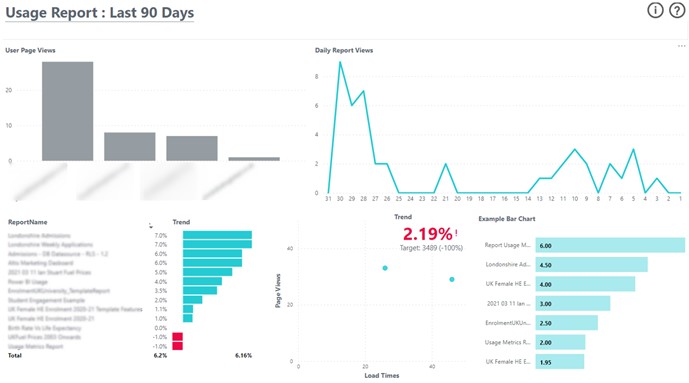
However, the 90-days of data limitation still exists. Another limitation is that each usage report sits in its own parent workspace, meaning we can’t report and analyse across all workspaces at once. We need to create a new report for each workspace.
Build your own solution using the Power BI REST API
Power BI administrators can access data on many activities from audit and usage logs using the Power BI REST API to not only monitor report usage but also, activities such as workspaces created or deleted and data refreshes not available in the out-of-the-box Power BI Usage Metrics Report.
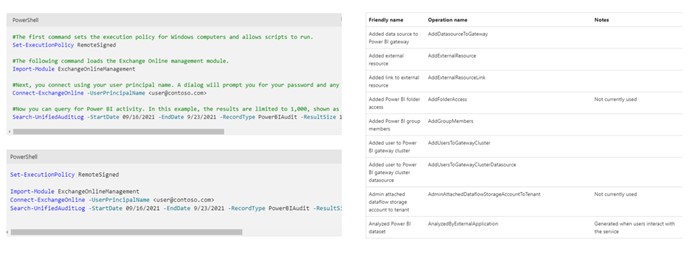
This is a very flexible option and by adding a process to capture historical data, removes the issues with the 90 day time limit. Retrieving usage data through the Power BI Rest API requires experience and understanding of Powershell and in retrieving data from APIs. Additional skills and time are then needed to transform this data into a usable and visually appealing Power BI report.
The Altis Power BI Insight solution
Recognising the importance of tracking usage as part of the wider Power BI adoption and maintenance strategy and the challenges of both the “out-of-the-box” and “build your own” approaches described above, Altis has developed Power BI Insight, leveraging the power and flexibility of the Power BI REST API with best practice usability and data visualisation techniques. All the usage data, not just the last 90 days, is held securely in the Azure cloud and can be frequently refreshed.
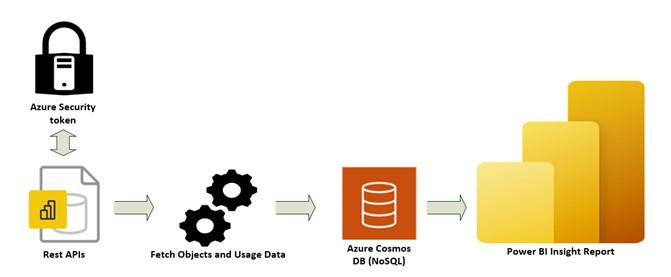
The Altis Power BI Insight solution offers several pre-built reports providing deep insight into the way Power BI content and the Power BI tenant is being used.
The following screenshots highlight some of the capabilities of the Altis Power BI Insight solution.
Usage overview – providing top-level metrics on a single page.
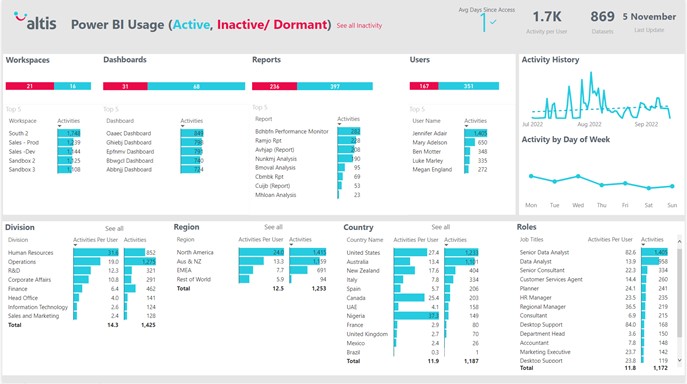
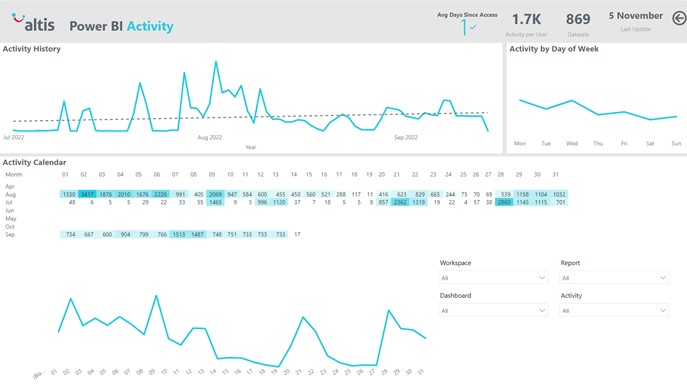
Activity over time – Tracking usage over any period for which usage data exists, not just the last 90 days as per the out-of-the-box solution.
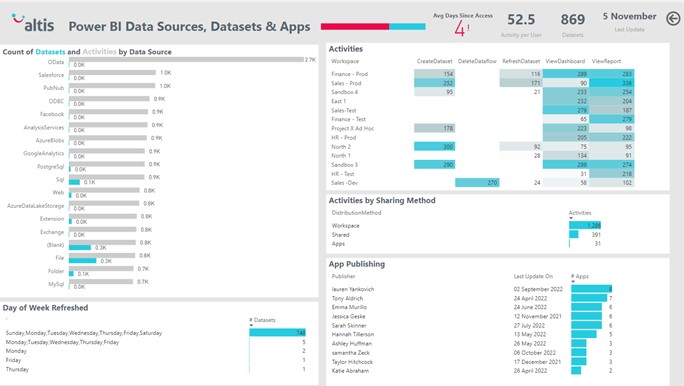
Data Sources, Datasets & Apps – The report offers the flexibility to track dataset sources, app refreshes, updates etc.
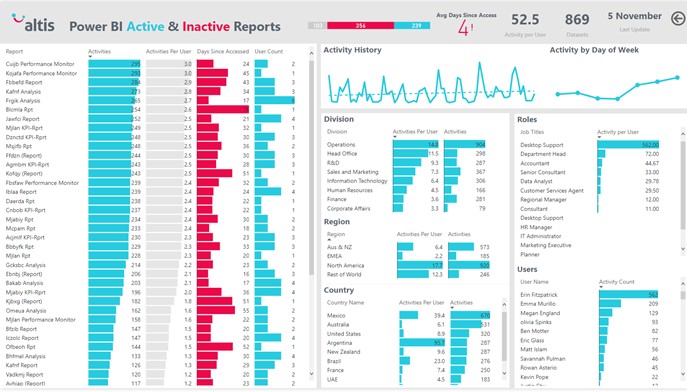
Workspaces, Reports and Dashboards view – Which workspaces, reports and dashboards are being used most and by whom – user, job role, department, etc.
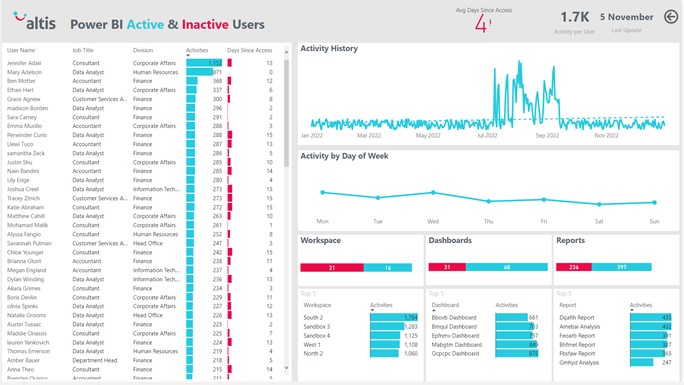
User analysis – Which users are viewing which reports and when.
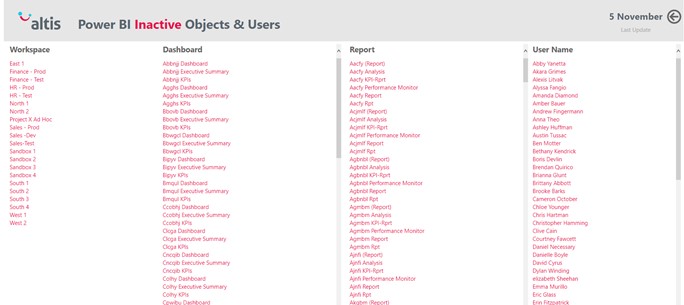
Inactive Objects and Users – Invaluable for maintaining the Power BI tenant by earmarking content that can be removed or users who do not need licenses or who may need help with their adoption of Power BI.
The Altis Power BI Insight solution provides the above functionality without the need to write any code or build any Power BI reports. The short video below provides an overview of the Altis Power BI Insight solution.
We’d be happy to talk with you about your Power BI usage measurement requirements and see which option might be best for you. Altis can assist with customisation of the Power BI Usage report or through implementing the Altis Power BI Insight solution.
Connect with us to learn more.
