By Ian Stuart, Data & Analytics Consultant, Altis Consulting UK
Background
Many organisations have now implemented Power BI and some have allowed report development to go ahead with few, if any, controls. The result is that reports can take longer to develop than they need to, be of variable quality, and they will inevitably be inconsistent in terms of look and feel. This can be confusing and frustrating for the end user whilst costing more than it should.
Fortunately, there are solutions within the Power BI ecosystem that can help to rectify such problems. In an earlier blog, my colleague Roger wrote about Speeding up Report Development Using Power BI Themes. Themes are a great start, and we would recommend you use them, but we also have Power BI Templates at our disposal which can take quality, speed of development, and consistency to another level. In addition, we have developed an Altis Power BI Template that you can use as a starting point; more on that later in this blog.
Skip to the end of the blog to watch a video summary of the Altis Power BI Template.
What is a Power BI Template?
In short, a Power BI Template is a starting point for every report that we want to create. Power BI Templates consist of several elements such as visualisations, titles, buttons, parameters, data or metadata, bookmarks, and (not least) a Power BI theme file.
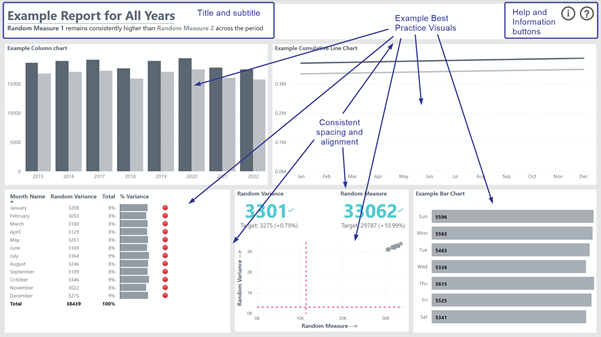
The template should contain only those elements that are going to be used in most reports (albeit customised) and perhaps some example best practice visualisations.
For example, we would expect every report to have a title. The font size, colour, and the position of the title will not change from report to report. The title itself will. Similarly, we probably want to provide help text to our end users in each report. The help buttons can be identical on each report and the method of surfacing the help (e.g. transparent overlay or separate help page) can also be identical. The help text will need to be customised.


How to Create a Power BI Template
The mechanics of creating a Power BI Template are simple. From within Power BI Desktop, we simply “Save as” and choose Power BI Template (*.pbit) rather than *.pbix):

That is the easy part. Deciding what goes into the template, creating the theme file, designing according to best practice, and creating complex functionality (such as a semi-transparent help overlay) takes time and experience – a lot of it.
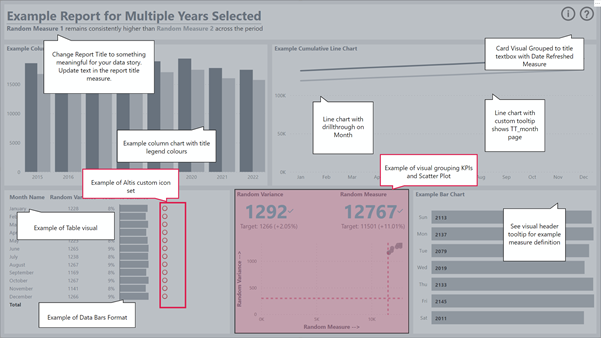
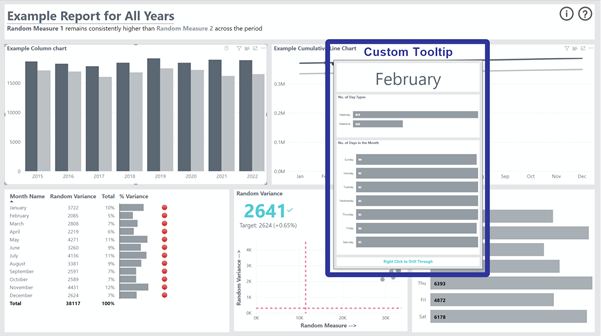
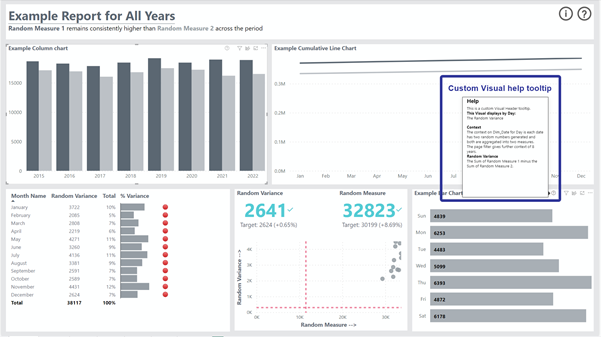
We have developed an Altis Power BI Template using the combined experience of our Power BI and data visualisation specialists. We have baked in data visualisation best practices so that report writers are equipped with a good starting point to best communicate stories with data. We have included high-quality elements such as custom visual tooltips, custom visual help tooltips, custom icons, and further innovative help provision.


Our template is available for you to purchase and, included within the price you pay, it will be tailored for your organisation. Building your own template is free but you may not have the time or expertise to create exactly what you want.
How to Use a Power BI Template
Again, it is simple. The *.pbit (Power BI Template file) should be placed in a location that all Power BI report developers can access. Simply double-clicking on this file from Windows Explorer will open an “Unititled.pbix” file in Power BI Desktop. The developer is then able to connect to their own data and create visualisations according to the stories they need to tell.
A User Guide is included within the Altis Power BI Template which, again, will be tailored as part of the purchase price.
Altis Power BI Template Benefits
Speed of development
Customising pre-built elements in the Altis Power BI Template takes considerably less time than creating each common element in every report from scratch every time we develop a report.
Consistency
Using pre-built common elements in every report we will improve consistency in look and feel across your reports, making it easier for the users of your report to understand and navigate.
Quality
Contained within the Altis Power BI Template are some very high-quality elements that include advanced technical functionality and are aesthetically pleasing.
“Studies have shown that more aesthetic designs are not only perceived as easier to use, but also more readily accepted and used over time…”
Storytelling with data, Cole Nussbaumer Knaflic
Branding
The Altis Power BI Template incorporates a Power BI Theme file which we will customise to your corporate branding allowing the formatting, look and feel of reporting to be quickly standardised.
Story Telling Enhancement
The Altis Power BI Template helps you tell better stories with your data with these additional features:
- Dynamic Title Legends
- Custom Icon Set
- Example best practice visuals
- Visual grouping allows for specific visuals to be grouped and appear as one
Enhanced information in the report
The Altis Power BI Template offers the following features to enhance the information available about the report for users:
- Custom visual help tooltips and custom tooltips
- Drill-through page for navigation to underlying data
- Help button with a semi-transparent overlay
- Report Information (metadata) button and pop-up
Pre-built functionality
The Altis Power BI Template also provide the following pre-built features:
- Parameters for File Path & Report Author
- Pre-built measures (e.g. Report Title, Date Refreshed, Author)
- Measures table for miscellaneous measures
- Rich Date Dimension
Summary
If you find that Power BI reports developed in your organisation are inconsistent, of variable quality, and take a long time to produce, then I urge you to consider using a Power BI Template. You can create your own or you can shortcut that process by procuring the Altis Power BI Template and having us tailor it for your specific needs.
In another Altis blog titled Using Power BI to analyse Higher Education Female STEM enrolments, my colleague Roger embedded a Power BI report built using the Altis Power BI Template. The embedded Power BI report is interactive so you can see the Altis Power BI Template functionality in action for yourself.
Please feel free to connect with us to learn more about how we can help you to fast track your journey to quality consistent reporting in Power BI.
