Enhanced dbt data quality observability at speed
![]() 14 minute read
14 minute read
2 October 2024

The term Data Quality commonly refers to the measure of a dataset’s accuracy, timeliness, completeness, and fitness for purpose. The ability to measure, monitor and observe the quality of data, builds trust and confidence which drives the consumption of data services within organisations.
dbt (Data Build Tool) is a well-regarded ELT (Extract Load and Transform) service providing data transformation, testing, documentation, orchestration, and governance capabilities all in one solution. For those of you new to dbt, it includes many data quality features including the ability to automate data and unit tests, configure source freshness tests, view test and deployment results; and manage how results impact model builds. dbt provides comprehensive logging across all activities, however as of today does not provide a single pane project level overview of results with drill-down capabilities for fine grained views.
Why is a Project Level overview of results important?
Before answering this question, let’s take a step back and consider what a typical large scale dbt project implementation may look like. Firstly, there may be a number of environments configured to support the model lifecycle development process. Typically, these would consist of Development, Staging and Production, or a slight variation thereof. Next, there can be a number of different data layers in the data architecture ranging from sources aligned through to business aligned data models. Layer names vary between implementations, however it’s common to find 3-4 layers configured for this purpose. The Medallion Architecture is one example of this approach. Finally consider that a typical project would include the ingestion of data from tens if not hundreds of source tables to generate the reports, dashboards, business aligned datasets and any other number of data products, each with their own respective data pipeline requirements. A large-scale project could quickly grow to hundreds of dbt build jobs and thousands of tests.
You can currently gain insights into model deployment and test failures in dbt Cloud in one of two ways:
- Using the Deploy Jobs UI to open every job and scroll through each log to manually pull-out warnings, errors and skip entries, and then manually collate these. This method would be extremely slow and prone to human error. It does not scale well.
- Using the recently added Explore UI to view results of Model or Test runs, however these do not provide an aggregated view of test results by source or subject area. Additionally, the ability to create customised views or dashboards is also limited.
Implementing the following solution will enable your organisation to solve for broader project observability in a matter of days.
Enter dbt Packages!
dbt Packages enable your teams to build functional solutions once and share them across the organisation. They can be thought of as analogous to python modules which can installed and used across your dbt projects, reducing development time, and promoting re-use and consistency.
I consider dbt packages to be a force multiplier in accelerating the development of dbt projects. The dbt Package Hub provides an extensive list of community packages which you can readily reference and use against your dbt project. Community dbt packages can also be pinned to specific versions mitigating the risk of breaking changes cause by new feature releases.
The key advantages of leveraging Community dbt Packages include the ability to:
- re-use pre-built packages, greatly reducing the development cycle.
- extend sourcing of solutions beyond your direct organisation at little or no cost
- access and review source code to assess suitability.
- extend packages by customising them for your needs.
In balancing these benefits, you should also consider the following best practices:
- Review and assess dbt packages code against organisational standards and policies. Typically, this would be performed by Technical Leads during code review sessions.
- Pin dbt Packages to specific versions to mitigate issues arising from breaking changes.
- As with the development of any dbt models, implement tests to validate expected functionality.
- Account for the effort required to manage and maintain package updates.
With this in mind, let’s dive into how we can enhance data quality observability using a dbt Community Hub package named dbt_artifacts developed by brooklyn-data.
dbt_Artifacts Package – What is it?
dbt_artifacts package is a package maintained by brooklyn-data which provides a simple to implement method for capturing dbt job run results metadata and pushing it to data tables on your data platform of choice. It currently supports Snowflake, Spark, Google BigQuery, Postgres and Databricks platforms.
What do you get with it?
Out of the box, the dbt_artifacts package provides you with base tables covering the following items in your dbt project:
- models and model execution
- tests and test executions
- job run invocation details,
- seeds and seed executions,
- sources information,
- snapshot and snapshot executions.
- exposure and current model information.
Additionally, dbt_artifacts provide you with dimensional model views which you can leverage to start visualising data with your preferred BI tool as speed.
The Brooklyn-data team also host a dbt docs site which describes all dbt_artifacts package generate models and macros which is a must to help you understand their data model.
How do you implement it?
dbt_artifacts’ key advantage comes from its implementation simplicity. It can be deployed and start collecting information on your project jobs within minutes. The dbt_artifacts package site provides detailed implementation information. For your convenience I have provided a quick summary of the steps below:
1. Install dbt_artifacts by adding the package details in your project’s package.yml file and running dbt deps.
2. Update your dbt_project.yml file with the following on-run-end macro which pushes results to the dbt_artifacts tables.
on-run-end:
  - "{{ dbt_artifacts.upload_results(results) }}"
You can also add conditional logic with dbt environment variables to ONLY trigger the on-run-end hook for say Staging or Production. This helps to minimise costs and maintain performance.
3. Run the tables in your environment of choice using the following dbt command.
dbt run --select dbt_artifactsAnd that’s it.
Dbt_artifacts will continue to capture your project metadata as you add new resources and models and run dbt jobs.
Let’s see some output examples!
Accessing data collected via dbt_artifacts provide insights to many questions across business and operational concerns related to data quality. Here are example dashboards created on top of dbt_artifacts package data. I developed a custom model with minor transformations on top of the dbt_artifacts base tables to simplify dashboard creation.
This example has been taken from a dbt cloud implementation, however the packages also work for dbt core.
In this example, we have a few deployment jobs configured in a “staging” environment, and we would like to understand the overall project test results at a glance.
Below I have configured a summary dashboard with metrics representing the percentage of passed tests and highlight tests with “error” status indicating critical issues.
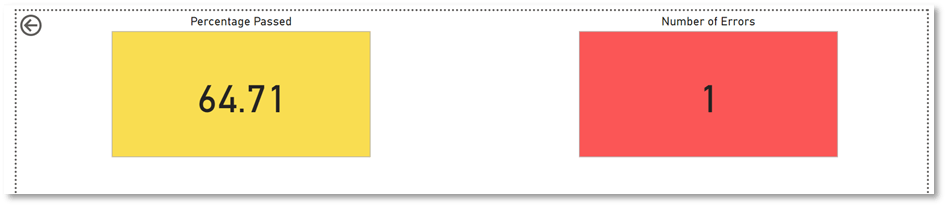
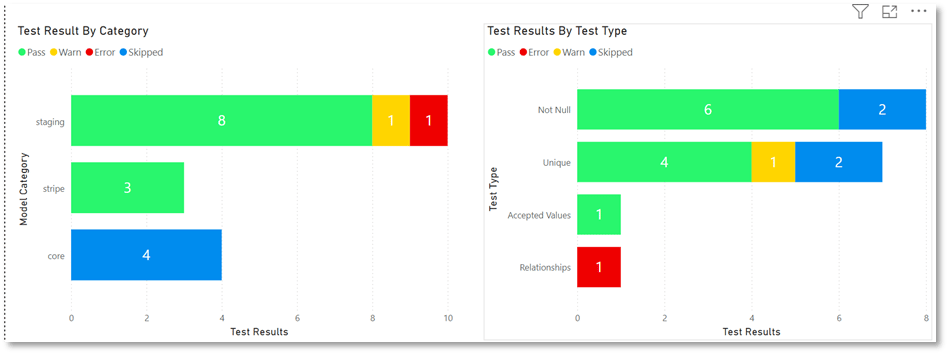
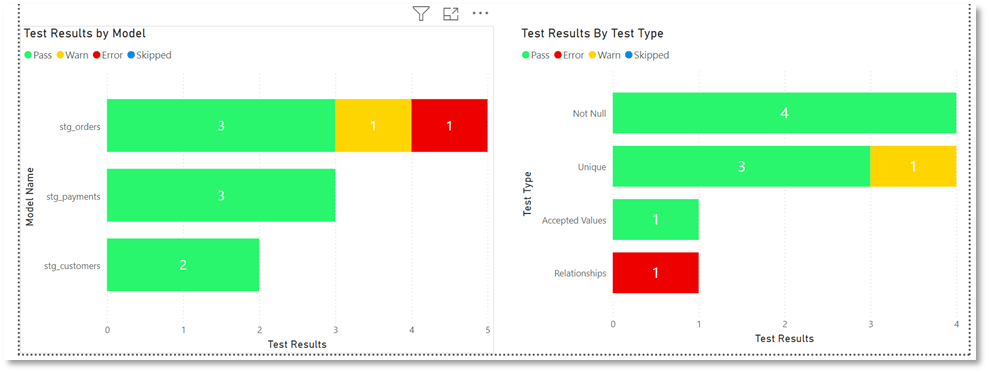
Additionally, I have added two charts depicting test results by project layer and test type. This allows us to quickly start focusing on problematic areas.
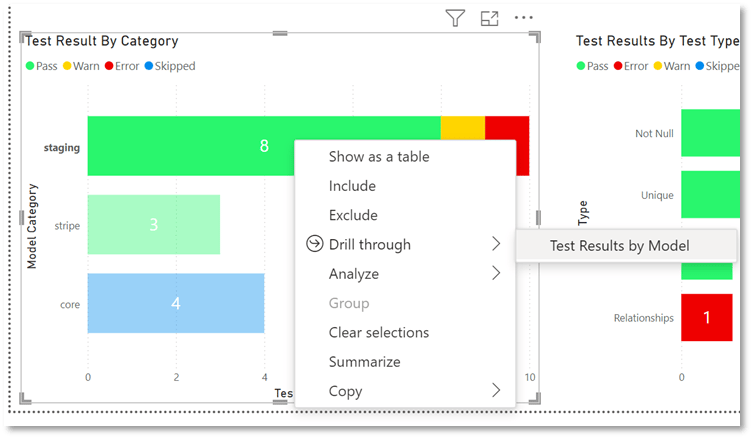
Next, I have configured the ability to drill down into model layers to expose the specific model test which are throwing test warnings and errors.
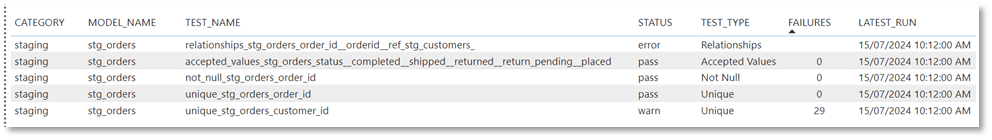
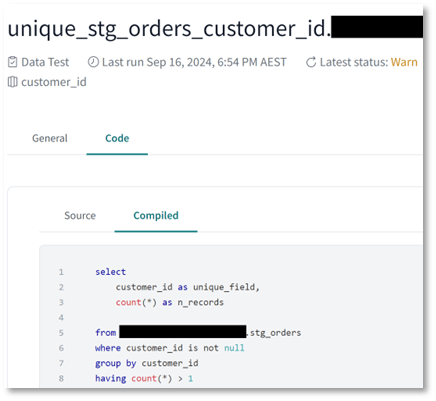
Finally, we can drill down on to a detailed view of models by test results to expose the actual test names. As an added feature I have configured “test_name” values as URL links back to dbt explorer test pages. This is possible as dbt passes test names are URL parameters so all you need to do is configure link to pass test name as a parameter. This last step allows us to drill into test compiled code assisting deeper investigation and issue resolution. You can also set notifications on metrics in any of the dashboard layers described here. These do not replace dbt job notifications, but rather complement them by enabling more complex notification triggers.
Given the depth of information collected via dbt_artifact package tables and views, it is quick and easy to start building operational and business dashboards, presenting a project wide view of your data quality posture.
At Altis, we work closely with our data customers to help them drive greater value from their technology investments and meet their business outcomes. We would love to hear from you and help you on your organisation’s data journey! Please connect with us via the form on our website.
Topics
Related insights
Share
Other insights


Contact us via the form on our website or connect with us on LinkedIn to explore the best solution for your business.