by Ian Stuart, Principal Consultant – Altis UK
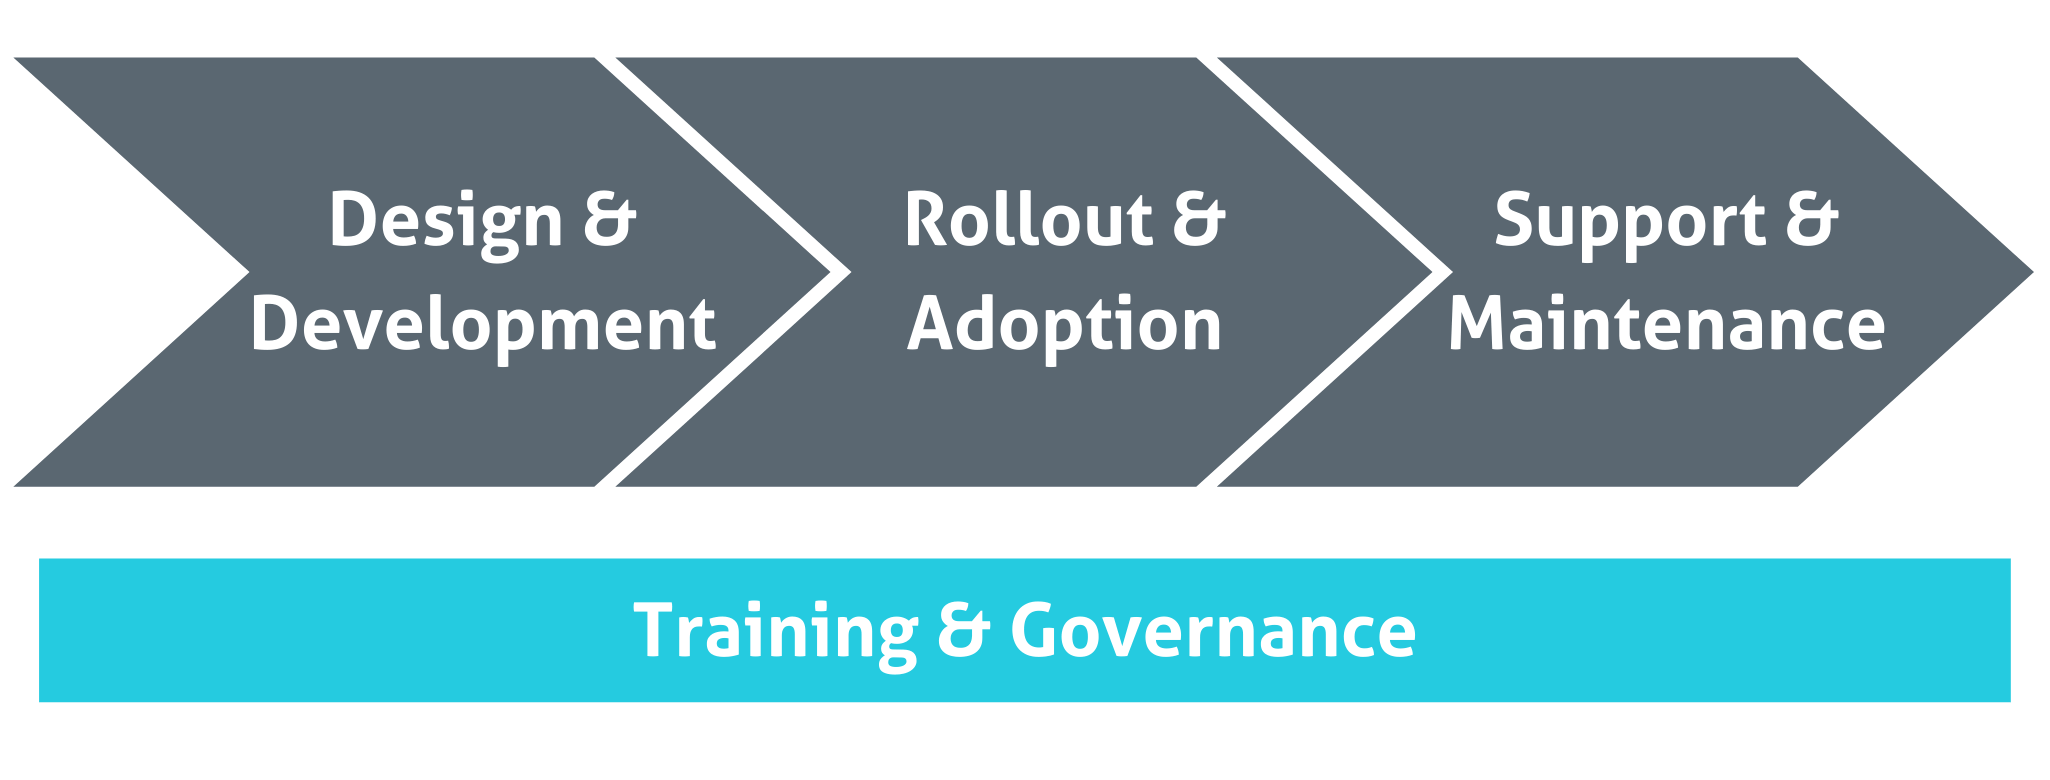
In the first blog of this series, I outlined the three key steps that we need to focus on to ensure that usage of Power BI is effective in our organisations. I then delved into Training and Governance that provides the foundation for us to get started on our journey.

In this blog, I am going to discuss the key factors of our Power BI Design & Development approach to help you achieve Power BI success.
There are several facets that require careful thought regarding their design and development:
- The data platform and the data model to ensure that we have a performant and easy to understand base on which to build our reports.
- Data visualisation (reports and dashboards) so that we convey information correctly and that it is easily and quickly understood
- The process of deploying and updating reports, datasets and apps so that we don’t break things.
A. Our data platform may be wholly contained within Power BI as a “dataset” or it may have been prepared and stored elsewhere in a data warehouse or data lake. This design choice depends upon many factors including:
- Numbers of data sources – how many databases, spreadsheets, web pages and other source systems are we gathering data from?
- Size of the data. Do we have thousands or millions of rows in each source? How many columns are in each source? What is the total size of the data when brought together. Is it going to increase over time?
- Complexity of the data. Are there complex cleaning and transformations that need to take place or is the data “report ready”? Do we need to store historical changes?
These considerations warrant quality time to ensure that we choose the right tools for the job. This varies between organisations. For example, Power BI has excellent data-wrangling capabilities but it may not be up to combining data from ten or twenty source systems. In this case, we may choose a more heavyweight ETL (Extract, Transform & Load) tool to prepare the data and a database (i.e. a data warehouse or data lake) in which to store the data. Power BI may still be used for the visualisations.
For further information on Data Platforms, see our recent Data Platform blog post.
B. Data Visualisation design & development is a highly iterative process that relies on understanding data visualisation principles, being able to engage stakeholders and understand their needs, as well as having the technical skills to build according to design. In our data visualisation best practice training we cover the stages of this process in detail

We start at the top of the wheel and work our way clockwise from stage 1 to 5 incorporating best practice and templates that we have developed over time. At each stage, we involve the stakeholders so that there are no surprises and so that they feel valued and are part of the process.
When we have completed stage 5, the journey is not over! More often than not there may be a new question that arises, or the business has changed, and so we go around the circle again. Understanding this cycle and embracing it can go a long way to minimising frustration and setting realistic expectations.
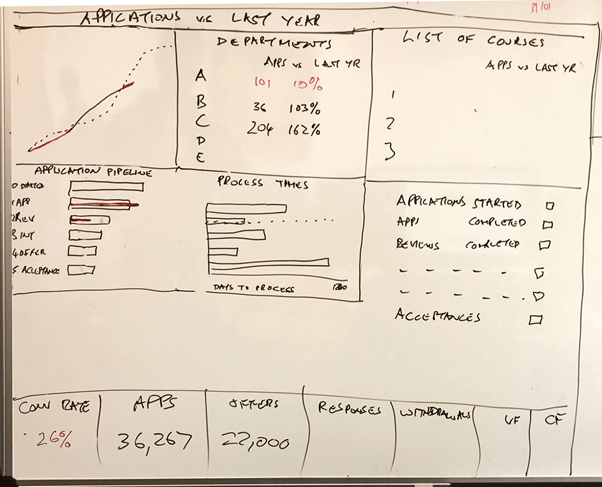
Whilst there is too much in this process to cover in a short blog post I would like to stress that step 3 is generally best done on paper or a whiteboard.

Diving into a tool to do the design may limit our designs to what is easily achievable in the tool and, therefore, limit our imagination. Far better to design what is required and then challenge your development skills to build it! You don’t need to get it 100% right up front, look how the above whiteboard version developed into the final version over multiple iterations:

C. The process of deploying and updating reports, datasets and apps depends upon another set of factors that includes:
- Power BI licence type (i.e. Premium Capacity)
- Existing change management processes that may exist in the organisation
- Governance restrictions and guidelines
There are a number of features in Power BI that can aide our deployment:
- Deployment Pipelines (currently Premium Capacity only)
- Workspaces & Apps
- Dataset certification
- Linking SharePoint or OneDrive objects
We can design a deployment process that includes some of these, but we are unlikely to use all of them. For example, we can decide that all of our reports are to be stored in specific OneDrive folders (e.g.: Development, Test and Production) and that these are linked to corresponding workspaces. We can have source control on the OneDrive folders and a process for promotion through the folder structure that has been agreed through our governance team (e.g. the Information Centre).
Such a process does not arrive “out of the box” with Power BI, rather it will require some whiteboard time with an experienced practitioner and the relevant stakeholders. Power BI does provide some tools that will assist the process.
The urge to get cracking with building reports is probably even more prevalent in Power BI than in other tools due to its ease of use and accessibility to the masses. There is value in experimenting with Power BI to help shape our design ideas but making time to think about and document our designs, and involving others in that process, before we start official development has been proven to save time and money as well as improving quality and helping to manage stakeholder expectations.
In this blog post I touched on the key elements of our proven approach to Power BI Design and Development as part of our overall journey to successfully delivering Power BI. In the next blog post (Part 3 of 4) I’ll cover Rollout & Adoption.
I delivered the following webinar of the same name subsequent to the publication of the blog series. I encourage you to watch it and please feel free to connect with us if you’d like to learn more about how we can help you be successful with Power BI in your organisation.
