A large retail corporation operating in Australia & New Zealand undertakes ownership, development, design, construction, management, leasing, and marketing activities for its centres, including tracking
and managing all health and safety incidents.
Objectives
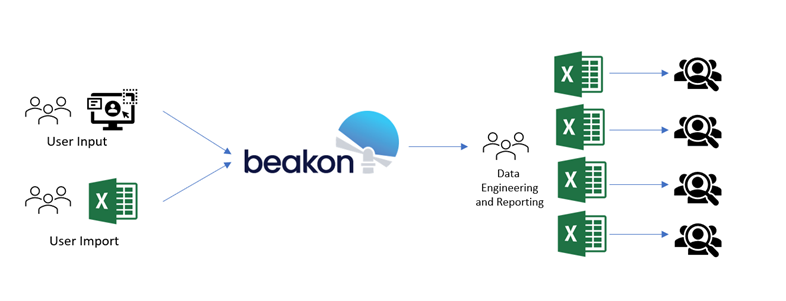
The client required KPI reporting from a customised Beakon application used to manage risk, security, safety and staff training for compliance. The previous solution used was excel based that was prone to errors, took several weeks to prepare and could not track historical trends. The KPI reports were required to be delivered to multiple audiences in either a detailed or aggregated fashion (i.e. Rolled up by region).

Having already started a migration to Google Big Query, the client approached Altis to deliver a more automated solution using Power BI to facilitate the current KPI reporting and allow for Self Service Reporting.
“It used to take us weeks of effort to build critical risk and safety KPIs. Now the effort is almost none”
The Solution
The client was already implementing a project to build a Modern Data and Analytics Platform utilising Google Big Query. After careful analysis of the existing reports and 160+ key KPI’s requirements Altis
established that by using a shared Data Model in Power BI we could reduce the number of reports and KPI’s required as well as simplify the report distribution using Power BI Apps instead of emailing Excel
files. As the new Data Platform was still in development, the data engineering tools in Power BI could be used to build the required Dimensional Model, and this could later be migrated back into the new Data Warehouse once completed.

Results
The Incident Analysis data model and reports were successfully created in Power BI, and the reports were well received, and widely adopted – reducing significant manual effort from the client.
Key outcomes:
Reduced Report Building Time – Where previously weeks were spent building reports before they were distributed, now only a sanity check is required.
Reduced Reporting Collateral – Multiple Spreadsheets containing different sets of business logic and historical data, has been replaced by a single Power BI Model and a handful of reports.
Enhanced Security – Report data can now be managed with Row Level Security and aggregated to serve multiple audiences with a single report easily.
Uptake and Adoption – The Power BI Model was modelled and built from an organisational view which was not dependant on the source system. Hence, two more business units have been able to be onboarded onto the Shared Power BI Model.
Self Service Reporting – Advanced users can now also use Power BI to build their own reports with cleansed and approved data, instead of using extracts from the source systems.
Do you want to find out more about KPI Reporting for Incident Analysis?
Connect with Altis today to find out how we can help maximise your business performance.
