


by Samuel Ward-Riggs, Managing Consultant – Altis UK
We rely on information to do our jobs every day, information provided to us by Data Platforms. But what exactly is a Data Platform, and how does today’s information request turn into tomorrow’s KPI dashboard? Join me at the whiteboard to demystify Data Platforms and the jargon that surrounds them.
This first sketch is simple, but it describes the bleeding-edge innovations of the cloud-enabled, AI-driven, big-data world… and it’s been around since the 1980s.

View our whiteboard session below:
Analytics
We’ll start with the end in mind: Analytics. That’s where users get access to information that they need to do their jobs.
You’ve probably heard a lot of jargon that belongs in Analytics. Terms like: Business Intelligence; Advanced Analytics; or Self-Service. Analytics is also where Reports & Dashboards, Machine Learning, and Artificial Intelligence (AI) belong. The point of all these technologies, tools, and techniques is to derive value from data, usually by helping us (the workers!) to make better decisions.
Understanding the information that people want means having a definition, in common business language, for every byte of data available for analysis. Together these definitions form a Data Dictionary. Creating the Data Dictionary is a challenge because gaining a consensus across the entire business requires the involvement of… the entire business. Sometimes this means we must address the elephants in the room, perhaps by creating a single definition of Customer, or once and for all combining the Finance and HR systems to master the Organisational Hierarchy.
For instance, I have worked for several Higher Education institutions who had no clear definition of “Student”. This might sound strange, but the devil is in the detail. In addition to degree students, there are apprenticeships, students visiting from other institutions, students taught at other institutions but taught on university curriculum, military personnel on customised courses and calendars, and the list goes on. Suddenly, understanding what number should pop out when we count the student population has become rather complicated.
The end goal of the Data Dictionary is for users to understand the data they are looking at. This prevents Jill from Finance and Ben from Marketing showing up to a board meeting with two different revenue figures (or number of active customers, units shipped, project spend, etc.). In making this universal, agreed-upon definition we are said to have achieved a “single version of the truth” (another one for the jargon collection).
With the Data Dictionary as our guide, Analytics lets us derive value from our data.

Sources
Next let’s move all the way left to Sources, where data is generated and recorded.
If we know that we need data to do our jobs, we must identify exactly what data we need and, somehow, collect it. The data may be held in core business systems like inventory, sales, or payroll. Maybe it’s data about customer relationships, or budget and actual data reconciled from multiple systems. Sometimes data we need is outside the organisation altogether, in government publications or from industry third parties. It could be data entered into online forms, card payment transactions, or security footage. The data might be formatted as word processor documents, images, or purely numbers (the flow of water through a pipe, or a delivery vehicle’s GPS coordinates).
Whatever format the data is in, and wherever it resides, to get access to it we must first Extract it.
Sometimes we need to know what our business is doing right now, in the moment, like how much stock we have on hand, or the status of a support request created only a minute ago. In these cases, we want to see the changes in the source data as it happens, so we extract (or “stream”) the data in Real-Time. Oftentimes, though, we only need to know what happened in the past. We might want to compare our sales this week, month, or year with corresponding prior periods. These calculations only need to happen by the day, month, or quarter, so this data can be extracted periodically, in Batches.
We’ve determined that data resides in Sources and gets Extracted in Real-Time or Batches. Let’s elaborate on the whiteboard.

Integrations
How do we get from raw data in Sources to our agreed-upon definitions in the Data Dictionary? Presumably, we must apply some business rules. These rules might exclude certain source records, cleanse addresses, or de-duplicate customers (perhaps matching prospect records in marketing campaign mailouts to customers that purchased from us).
We first write down these business rules in a data Mapping and then translate them into data logic called Integrations (the “grunt work” of Data Platforms). The success of Integrations depends entirely on the accuracy of the Mapping, which is created by Subject Matter Experts (SMEs) within the business.
SMEs maintain the systems that are critical for business operation and are the go-to people for knowledge about the data. When data is needed to make informed decisions, SMEs respond to information requests. Often there is a delay while individual, customised reports are provided to users, frustrating both the requestor (due to delay) and the SME (due to workload). This can lead to the propagation of unmanaged datasets (usually spreadsheets), blended with other data by end-users who don’t know the complex source system rules like the SMEs do (Ben from Marketing, I’m looking at you).
Writing down these rules in the data Mapping enables automated data Integrations to be created which frees the SMEs from constant requests for data and allow users to have access to data on demand (called Self-Service).

Support & Governance
Now our whiteboard Data Platform has data that is Extracted from Sources and Integrated based on Mapping rules written by SMEs, providing Analytics to end-users. But users should only be able to access the data if they’re authorised to do so. And what happens if they can’t log in? Or if they have information that could impact a business rule or definition and they want to share it? And how do they even know the whole platform exists in the first place? To answer these questions, let’s introduce Support and Governance.
Data Platforms are often thought of as projects, but projects are temporary, terminating once they have achieved a pre-defined goal. Data Platforms, on the other hand, are necessary as long as the business continues to operate. Users need Support when using the enterprise systems and technologies within Data Platforms, and the data itself needs continuous Governance to ensure that it’s accurate, meets compliance, and is only viewed by the right people. Ongoing support of the Data Platform is a business function, not a project.
The Support team picks up the phone and responds to emails when users have problems, they proactively maintain the solution and provide training and documentation to new users. Within the Governance team, Data Stewards (often SMEs themselves) maintain data quality, keep business rules current, and ensure data security is appropriate across their relevant domains (e.g. Customer, Product, Employee). Data experts (often borrowed or “virtual” team members) contribute to new functionality: Data Engineers for performing Integrations, Business Intelligence Analysts for Reports and Dashboards, and Data Scientists for Machine Learning and AI).
The Data Platform relies on senior leadership to allocate funding and prioritise development, as well as to champion its use, encouraging new staff to gain value from it and removing the potential for different parts of the business to create their own “stovepipe” solutions. This guidance helps to foster a data-driven culture within the business.
To recap, Governance ensures compliance and quality of the data, and Support provides users with training and helps them to get the most out of the Data Platform.

Now that we’ve covered the elements of a Data Platform let’s add some final jargon to the mix. You might have heard of a “Modern” Data Platform which simply means that current technologies are used to move, store, and query the data (presumably a “Post-Modern” Data Platform would be better still!). The terms Data Lake, Data Warehouse, and Data Vault are also common and refer to specific ways in which data is stored and structured. These concepts don’t change the way users derive value from their data, so they don’t concern us here.
Let’s combine our whiteboard sketches to form a complete Data Platform.
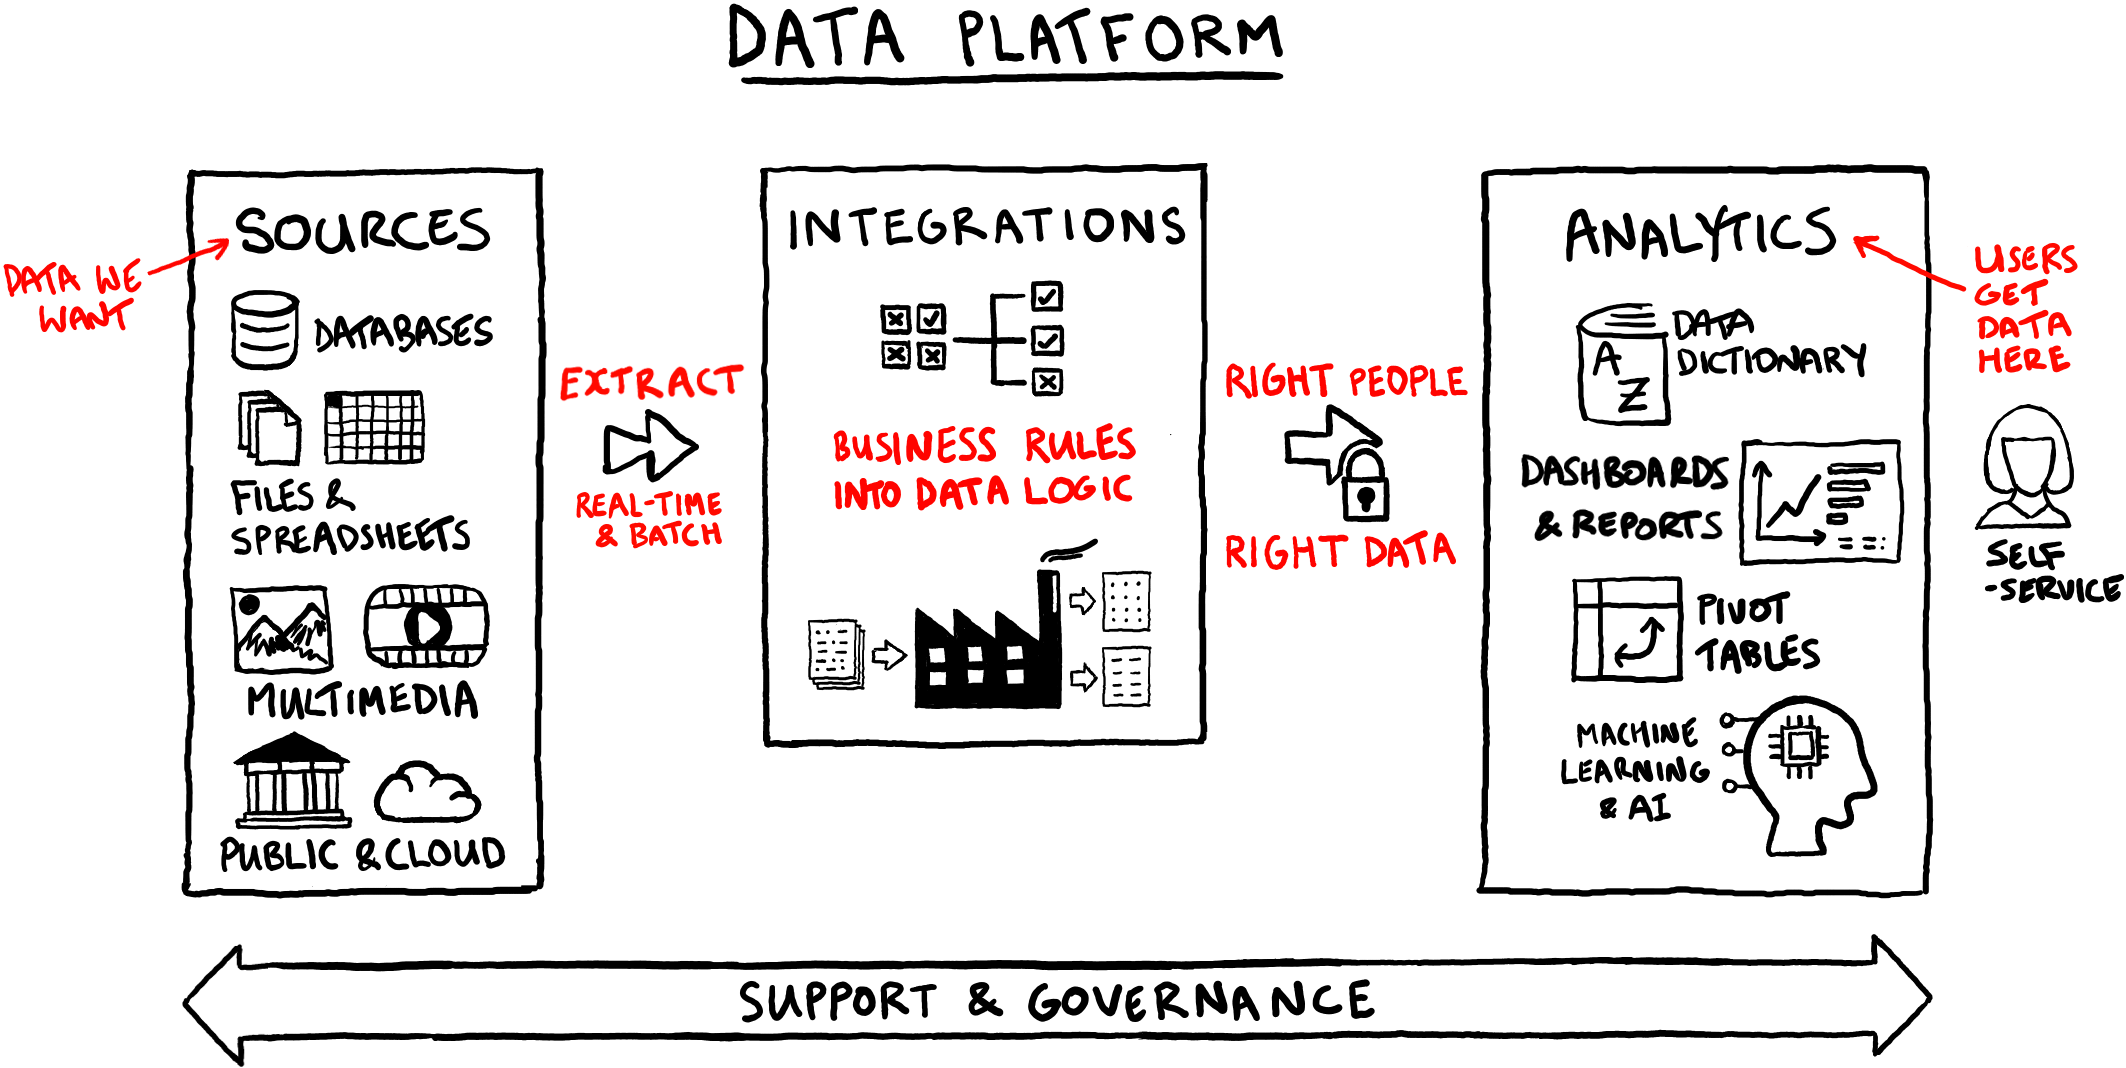
That brings our whiteboard session to a close. We started with the end in mind: Analytics. Aided by the Data Dictionary, Analytics lets users derive value from their data. Then we backtracked to discover the data we want in Sources. With the data Extracted we applied business rules written into a Mapping by transforming the data with Integrations. Data Governance provided us with high data quality and end-to-end security so that only authorised users get access. Finally, the Support team responds to our users’ requests for training and assistance.
And that, in a nutshell, is a Data Platform.