by Garry Farrell, Managing Consultant
There are always several considerations when looking at Power BI refresh performance. These can be internet/network speed, a gateway server memory and performance, database speed, physical location of cloud resources and the Power BI design itself. Even the Power BI design has many considerations, such as data compression, I will cover only two of them. I always start with the items that I can directly control, so here I will reveal my approach that I used at a recent client using a combination of Power BI Desktop parameters and Power Query folding. Most of the other considerations listed above would need the help of IT and would take more time to organise, investigate and test.
Power Query Folding can be used in several situations.
- Import model tables and OData imports.
I will discuss my solution based on Import model tables. - DirectQuery and Dual storage mode tables.
- Incremental refresh.
Like my colleague pointed out it doesn’t work for flat files, blobs, or web data sources.
The Problem
The refresh was taking too much time and additionally the data volume was growing. Unfortunately, the increasing data volume takes even longer to refresh. This was a situation that only gets worse.
Why a parameter?
The parameter was used to control the relative number of years of historical data to import and can be modified by a Power BI Admin from the Power BI service. Using a relative number of years means that the solution automatically continues to import the same number of years for each refresh. For our use this was implemented to reduce that data set size and prevent it from growing uncontrollably as the years pass. The client agreed to the minimum and maximum number of years that they required for their reporting purposes. Power BI Desktop files have a limit of 1Gb, and this was one of the major concerns. The refresh is faster when less data is imported and naturally if the reports will not utilise the older data, then we don’t require it in the data model. A smaller model has an additional benefit of usually faster response times when the DAX queries are executed, and the also when report visuals are rendered. This means happy users.
Initially, the file size did not reduce, and this is when I needed to investigate Power Query folding and why it had not reduced the file size. More on the parameter implementation later.
Why had Power Query folding not affected the file size? What had happened?
Query folding is the ability of Power Query to add logic from the Power Query steps to the query that is sent to the source database engine. In the case of history filtering, we need the filter that we set to end up as part of the query sent to the database. If it is not added to the database query, then the data set size will not reduce, and this will not provide the result that we wanted. The consequence of a filter in Power Query that is not folded, is that the in-memory data is filtered but only after the entire data set is loaded into the model which leads to poor refresh performance.
I had added the parameter and filter in Power Query after the original design had been completed. Therefore, the filtering step in was positioned after several other Power Query.
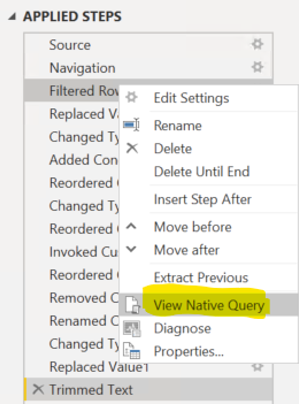
I found that the ordering of the Power Query steps is critical. To find which steps have been folded, right-click on each step and select “View Native Query”. (See figure below in the Solution) This is only an indicator that the query folding may have stopped, however this is not always conclusive. In my situation I knew that the query folding stopped since my filtering had not changed the resulting file size or the time to refresh the dataset.
The only conclusive way to check what has been folded, is to inspect the query that hits the database engine. Tools such as SQL Server Profiler or Azure Data Studio can be used to do this.
The Solution
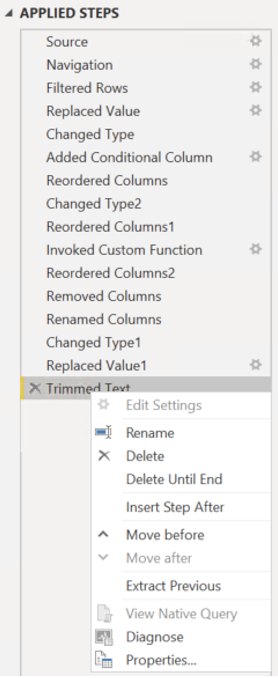
The solution is to perform the Filtered Rows step immediately after the Navigation step to make sure it gets folded. To do this simply click and drag the step to the desired location. After moving a step there may be errors. You have two options, fix the errors, or delete the step create it in the desired position.
In this example the query folding was discontinued at the “Changed Type2” step.


Implementing the Parameter and Filtering
The history filter flag has been created with the following code in the source database view. (getdate() was also converted from UTC to local time). In my case I needed a minimum of 2 years so the comparison of This Year to Last Year measures would still calculate values. So, the output for 0 and 1 were both set to 1.
CASE DATEDIFF(YY, TransactionDate,getdate())
	WHEN 0 THEN 1
	WHEN 1 THEN 1
	WHEN 2 THEN 2
	WHEN 3 THEN 3
ELSE 99
END HistoryFilterFlag
The resulting values will be 1, 2, and 3. The Power BI Admin can change the value of the parameter in the Power BI service to modify the behaviour. As the developer, we set the default value in Power BI Desktop so there is always a valid value.
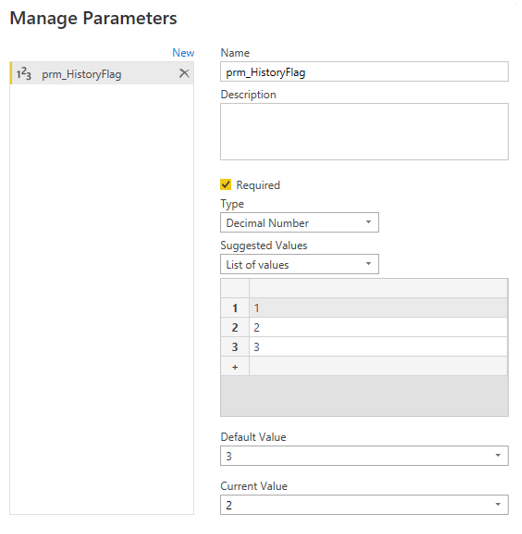
The filter step in Power Query is simple. Setup a parameter and use it to filter the HistoryFilterFlag column. In this example I created a parameter named prm_HistoryFlag. I have set the list of values to match the output of HistoryFilterFlag column in the database view. I set the default to 3 and the current value to 2.

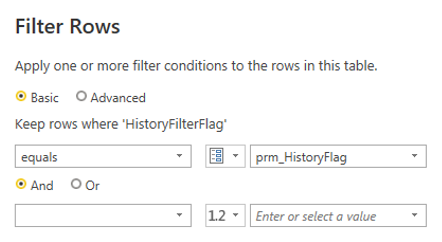
In Transform Data, select the column HistoryFilterFlag and filter that column using the parameter as shown below. Now the value of the parameter will be passed through to the database engine to filter the data before it is returned.

The Benefits
Simple to implement with many benefits. A happy client and happy users.
- Once the Power Query step was repositioned and the parameter was implemented and the Power BI Desktop file refreshed faster, the result was achieved.
- A smaller pbix file which leads to superior report performance. Another result was achieved.
- Also remember that this design should future proof the load from exceeding the 1GB data limit. Less maintenance is another win.
Connect with Altis if you’d like some help with Data Visualisation or Power BI within your organisation.
