Is Kimball Dimensional Modelling still relevant? A practical experiment comparing Dimensional Modelling to Normalisation for Data Consumption and Disc Space
![]() 10 minute read
10 minute read
2 July 2023

This is a controversial topic to say the least, not to mention when we also include comparing Inmon and Data Vault methodologies. However, for a while now I have been stuck on some points mentioned when comparing Kimball Dimensional Modelling vs Normalised databases. These are:
- Performance – As we have less joins results are returned faster, and it makes less complex to write queries.
- Disc Space – Dimensional Modelling uses more disc space than Normalised Data as we store repeating values.
Also considering that Dimensional Modelling was introduced in 1996, 27 years ago as of 2023, I thought it worthwhile to put these to the test. We all can agree that in the past 27 years, a lot has changed in the data landscape not to mention in database and hardware technology. Not only was cloud not available in 1996 but we can also argue that server virtualisation was not yet mainstream in the industry.
I set out to develop a test scenario and came up with the following parameters that I felt reflected a commonly used Platform as well as data volumes that are not uncommon in the industry today.
- Platform: Azure SQL Server S2 Instance
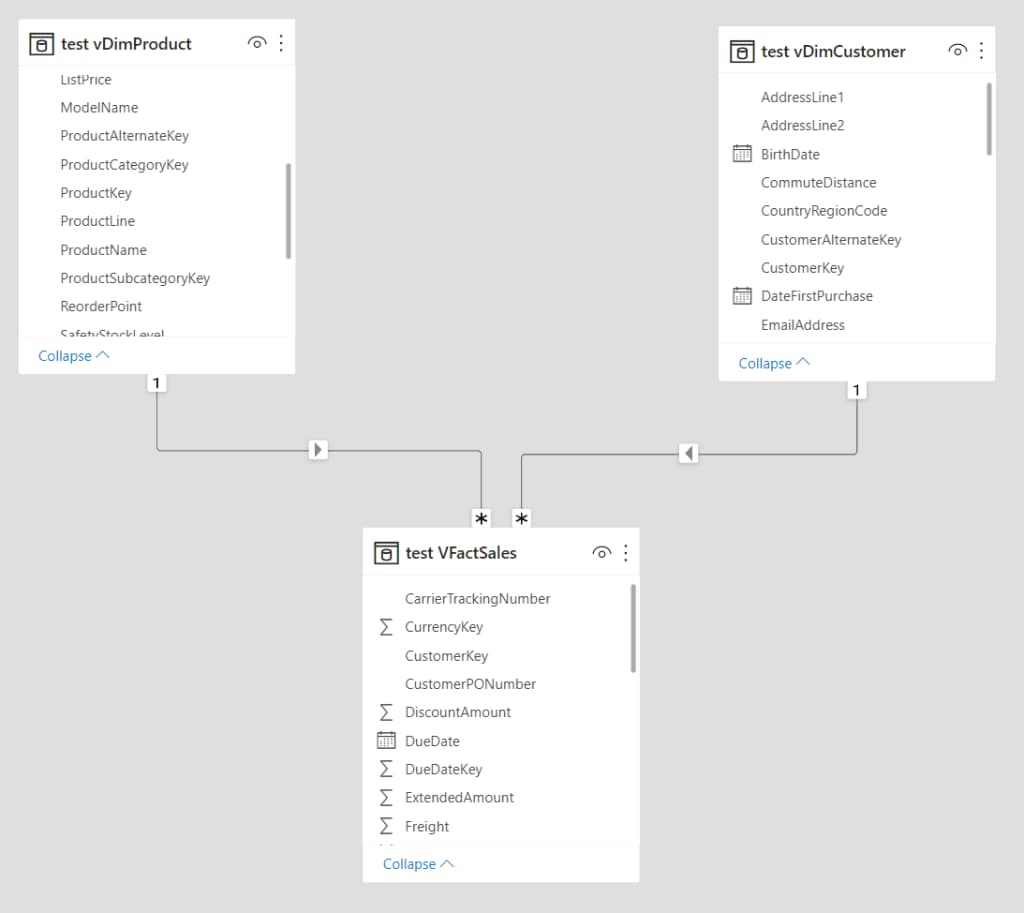
- Data: 1 Fact Table and 2 Dimension Tables
- Fact Sales (6 million Rows)
- Dim Product (121 thousand Rows)
- Dim Customer (1.8 million Rows)
The data used was the Adventure Works Data Warehouse Demo dataset with the selected Dimension and Facts enlarged with referential integrity to the desired row counts.
The test cases will revolve around disc space as well as performance to read the data, writing data to the tables was not tested as Data Warehouses are still seen to be fast read over fast write in most scenarios. The test cases will revolve around the Dimension Tables only as fact tables are the Surrogate Keys and the Measures.
Test Case 1 Disc Space Comparison:
The first test case compares the Data Size of the Kimball Dimension vs Normalised version. To make it more realistic on both tables the standard indexes we would suggest were added (Surrogate Key, Business Key and in the Normalised versions indexes was added to Primary and Foreign Keys).
Results
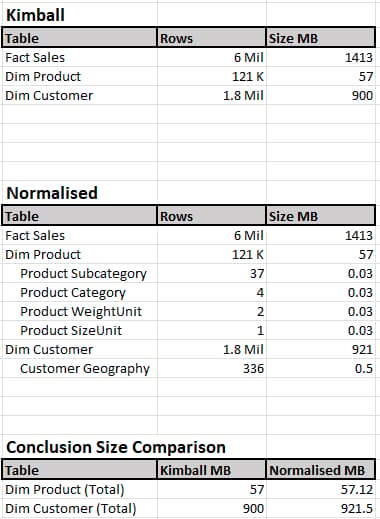
Conclusion
To be honest, I was expecting that Normalised would be the victor in this test case however, the results speak for themselves. In my opinion, the size difference is negligible with a 1.8 million row table being 21 MB larger in Normalised. An interesting point that I noticed during the test was that before the additional indexes were added to the Normalised Dimension Tables: The Dim Customer table was 850 MB before indexing, the 4 additional indexes (Foreign Keys) added +- 70 MB that pushed it over. Needless to say, we need those indexes to assist with read and write speeds on the data.
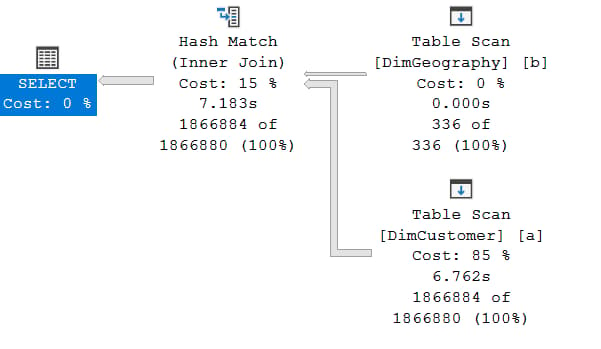
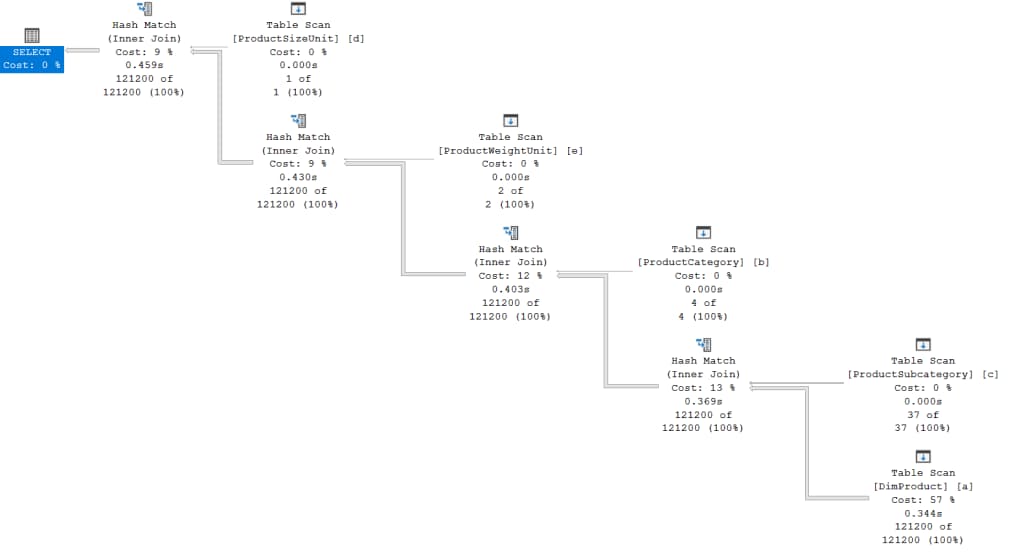
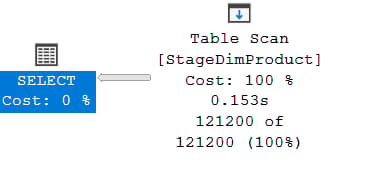
Test Case 2 Read Performance SQL Server Management Studio:
In this test case views were created using sully qualified SQL (No “Select *” statements in this test) to either read the Kimball Dimension or an Inner Join Statement that links the Normalised Dimension to its supporting tables. A fully qualified select statement was then created to read each view and executed 3 times on each view with no other queries running on the Azure SQL Server Database. As the test was performed on an Azure SQL Server database and over an internet connection latency and contention needs to be considered.
Results
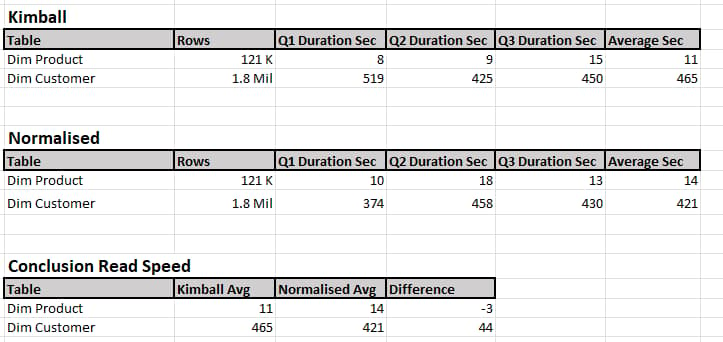
Conclusion
It is worth mentioning that in the performance of the Azure SQL Server Database never exceeded 20% average during any of the reads. Reviewing the results, the difference is minimal once again, in my opinion. The use case for returning all the rows in Management Studio may not be seen as “Real World,” however it does show full scans. We can argue that in the case of Normalised should we only need to return the supporting tables we do not need to read the larger dimension tables, especially if we are doing analysis on the data.

Test Case 3 Read Performance Power Bi Portal:
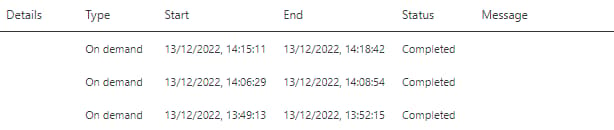
For the final test case I thought it would be best to get rid of internet latency. By taking each view from Test Case 2 and placing each one in its own Power Bi Model and refreshing from the Power Bi Portal we should be able to establish read performance using the Azure backbone. The test was performed on a Standard Power Bi Pro tenant with no Premium Capacity. Just like Test Case 2 the data was refreshed 3 times on both the Kimball and Normalised views and finally.
Results
Conclusion
Honestly, I was more surprised with the performance of the Azure backbone 1.8 million rows consumed withing 2 minutes into the Power Bi Service. In saying that, in this case, the difference in margin is small to non-existent with an average of 1 second difference.
To ensure this was not a fluke the 6 million row fact table was added to the models along with both the dimension tables and the same tests were repeated, reading the Kimball Modelled Dimension then the Normalised Dimensions. In both cases, the model was refreshed in an average of 3 minutes across 3 back-to-back refreshed.
What does this tell us?
I think at the start of this experiment I had a bias for what I wanted the results to be. The software developer in me likes the idea that smaller tables equal reduced read time based on the SQL Engine, Indexes and Cache makes perfect sense. However, looking at the results in for this Dataset and Test Cases the results shows that it does not always matter when data is being read. Writing data is a different scenario and writing takes more performance than reading, hence why normalised is proven for operational systems.
We also have the scenario that BI Reporting tools like Power Bi and many others still benefits from Star Schemas over Snowflake or Normalised data. An argument could be made to repeat the tests with Power Bi needing to join the Dimension and the supporting tables during the dataset refresh, I have no doubt we will see some form of a performance hit.
However, if we bring this back to the initial two points of testing
- Performance – As we have less joins results are returned faster, and it makes less complex to write queries.
Conclusion: With database technologies constantly improving having 1 table vs having multiple tables (within reason) does not seem to impact read performance too much. Semantic layers, database views as well as Data Virtualisation tools also assists to minimise any impact.
- Disc Space – Dimensional Modelling uses more disc space than Normalised Data as we store repeating values.
Conclusion: If we compare only the raw data size for these two then there is a valid point that normalising your data will save you some disc space, however of we follow proper indexing guidelines again that gap closes and even flips this on its head with Normalised Data requiring more space.
Final Thoughts
It needs to be considered that this test was not done one “Raw” Third Normal Form source system data, it was done on modelled data for BI Purposes. Third Normal form would probably have had much more supporting tables and that could lead to a larger performance gap. Thus, modelling your source data into an Enterprise BI Model is still key, along with all the benefits that comes with it. How you choose to implement and to store your Enterprise BI model when comparing Kimball to Normalised using technologies like Azure SQL Server seems less impactful when it comes to Read Performance and Disc Space requirements. The main concept shared between all data modelling standards whether it be Kimball, Inmon or Data Vault event is to model your data according to the Enterprise BI needs and not the source system.
Do you want to find out more about Dimensional Modelling?
Connect with Altis today to find out how we can help maximise your business performance.
Related insights
Share
Other insights


Contact us via the form on our website or connect with us on LinkedIn to explore the best solution for your business.